반응형
https://youtu.be/NyaffVfRzLo?si=GMyNA9SAGTHBh9yx
발표자: David Lorite / Jesus Samitier
- Engineer in Sysdig
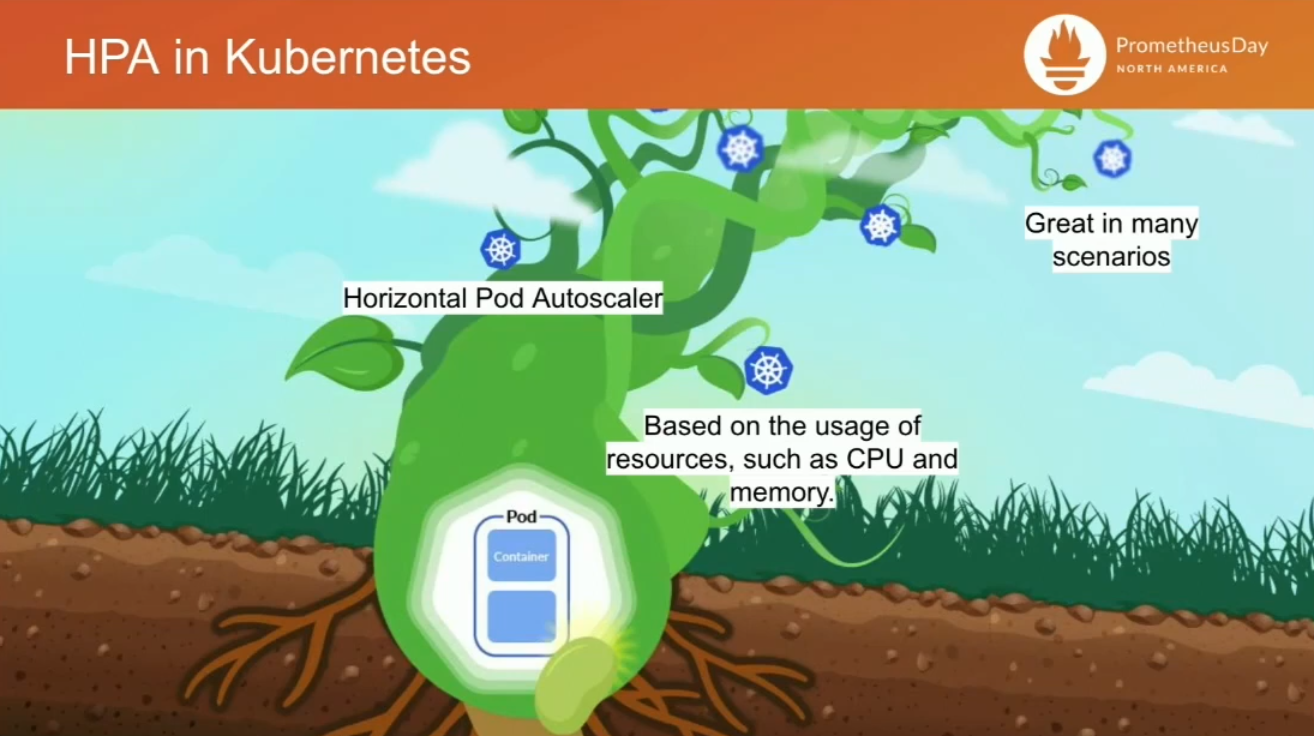
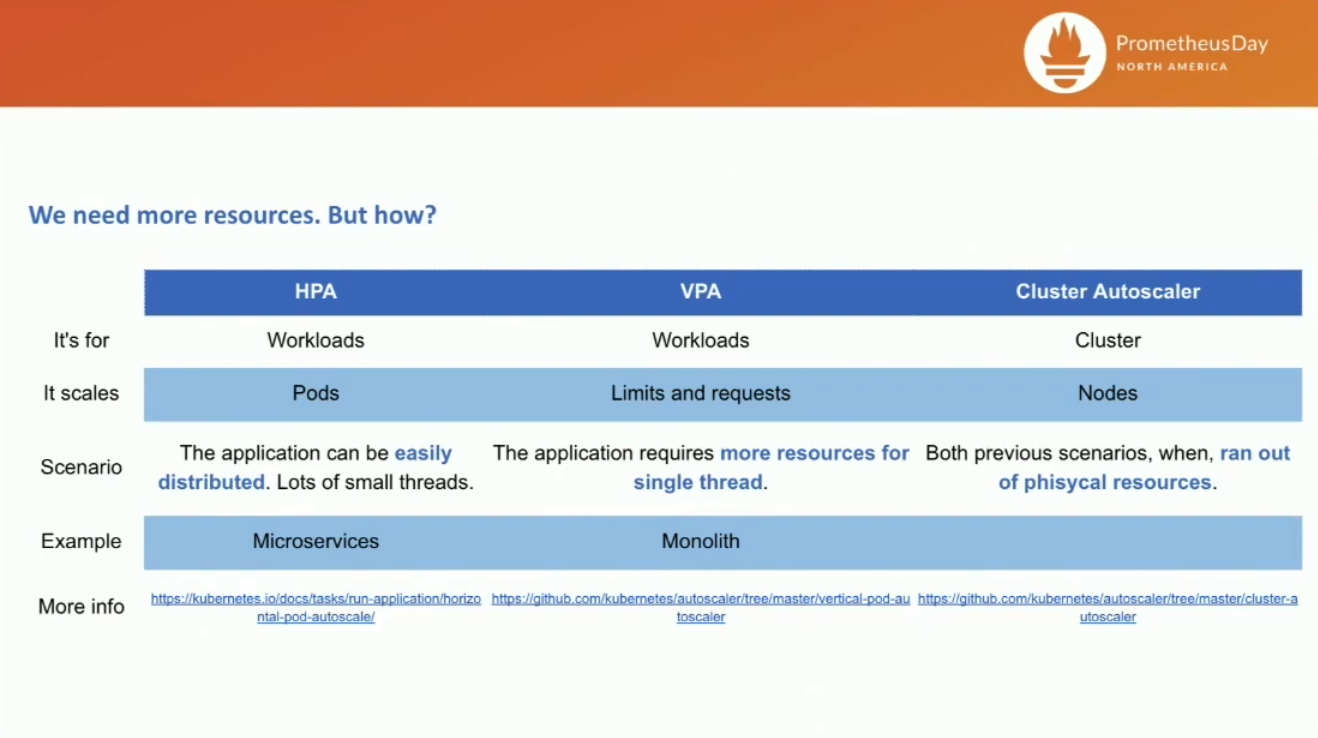
HPA: scale workloads Based on CPU / Memory Usage. 즉, Advanced Metric을 기본적으로 지원하는 구조가 아님.
따라서 특정 metric을 조합 / 연산하는 형태의 metric이나, CPU / Mem 외에 비즈니스에 중요한 metric를 기준으로 쓸 수는 없다.
- API Latency
- Number of TPS
- Waiting Connections in a Web Server
- Errors...
Prometheus와 PromQL을 사용해서 HPA를 작동시키면 어떨까?
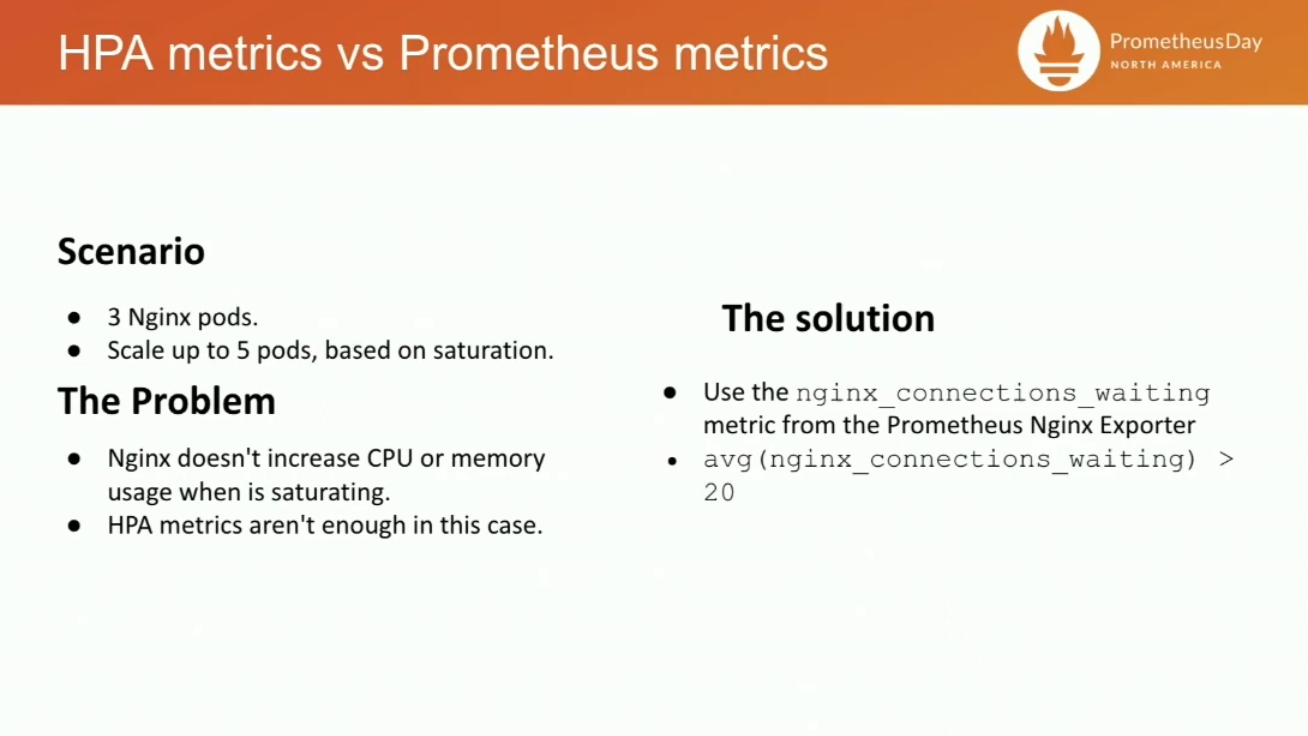
예컨대 nginx 서버를 saturation 기준으로 up to 5까지 scale out하고 싶다.
- saturation은 CPU / Memory를 차지하지 않으므로 원래는 HPA가 불가능.
- 따라서 이 경우 nginx Prometheus Exporter를 사용한다.
- nginx_connections_waiting 필드의 평균값이 20을 초과할 경우 scale up으로 간주
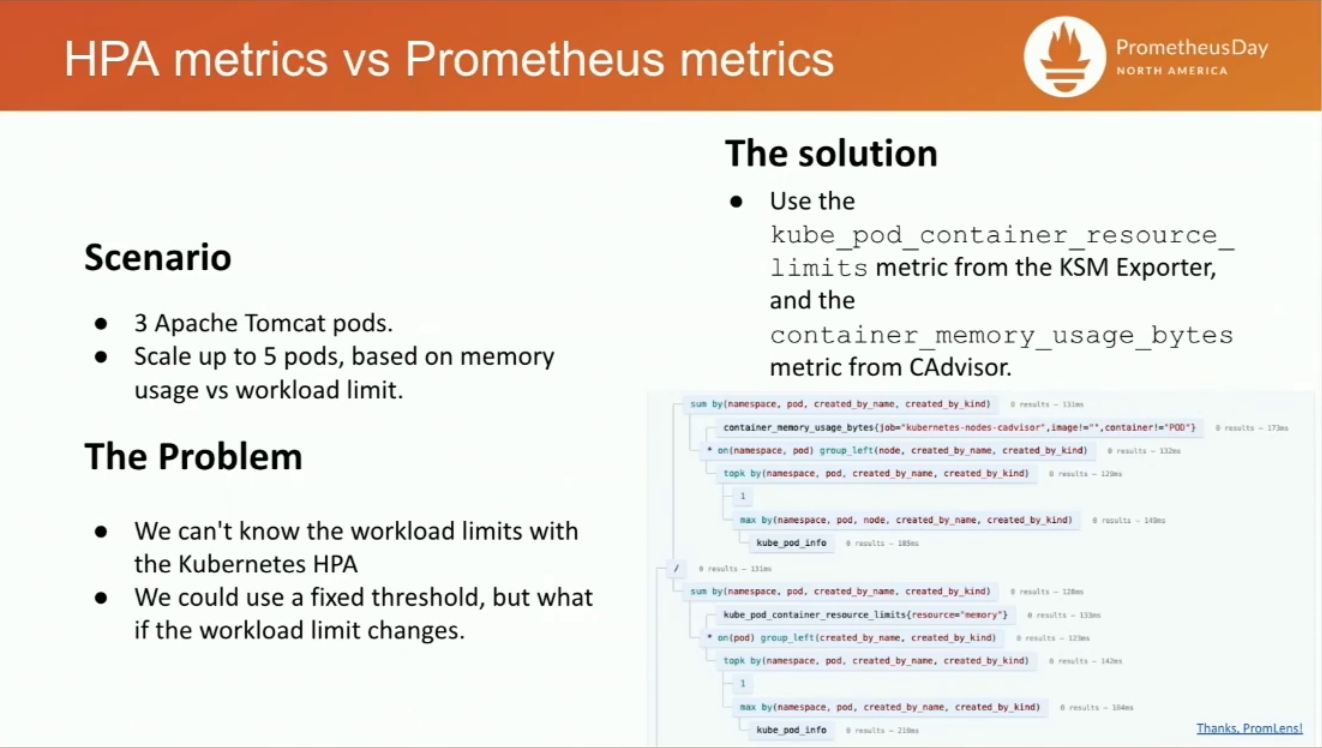
apache tomcat 서버를 memory 기준으로 scale out하고 싶다
- memory usage
- fixed threshold 설정이라서, limit이 변할 경우 유연햐게 대응하기 어렵다
- workload limit?
- 이건 HPA에서 가져올 수 없는 정보다.
이 경우, prometheus를 활용할 수 있다.
- kube_pod_container_resource_limit 로 workload limit 정보를 가져온다.
- container_memory_usage_bytes 로 메모리 사용량을 가져올 수 있다.
(container_memory_usage_bytes / kube_pod_container_resource_limit) 로 memory usage 비율을 구할 수 있다
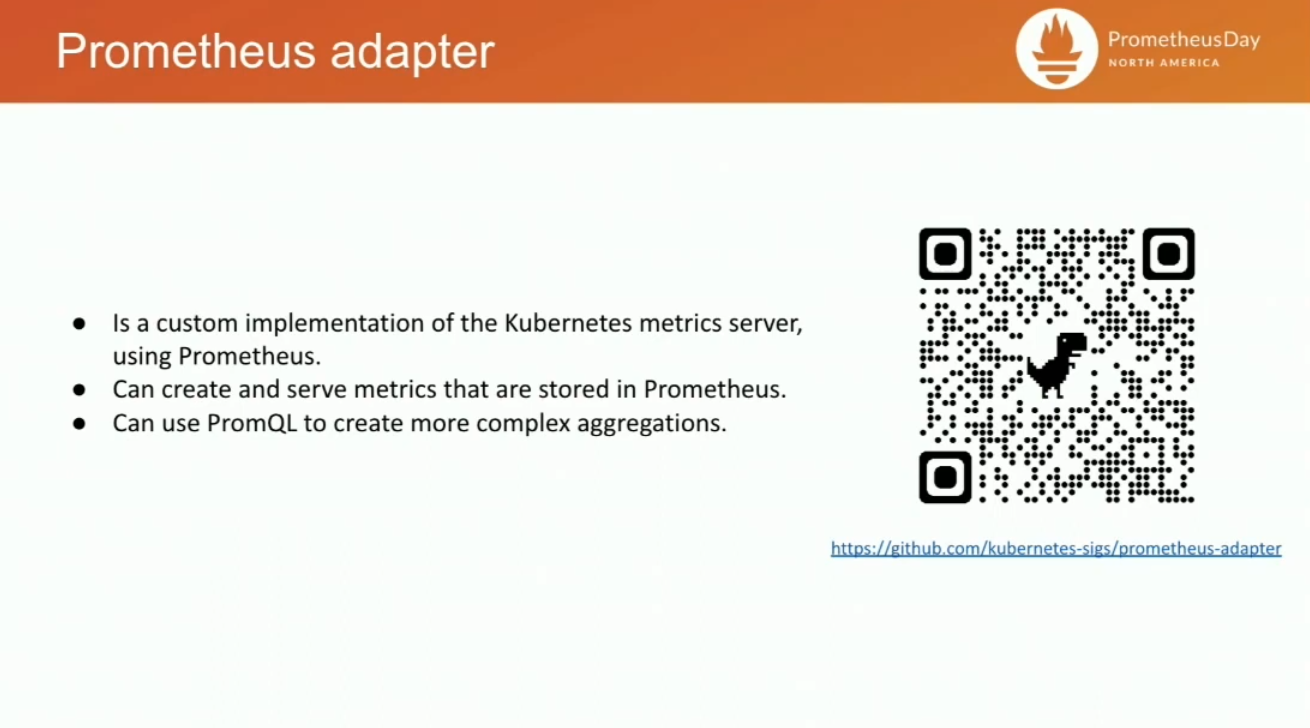
하지만, Prometheus Adapter에 metrics server를 붙이는 방식은 유연성이 떨어진다.
- promethues가 클러스터 외부에 있다거나
- prometheus 접근을 위해 인증이 필요하다거나
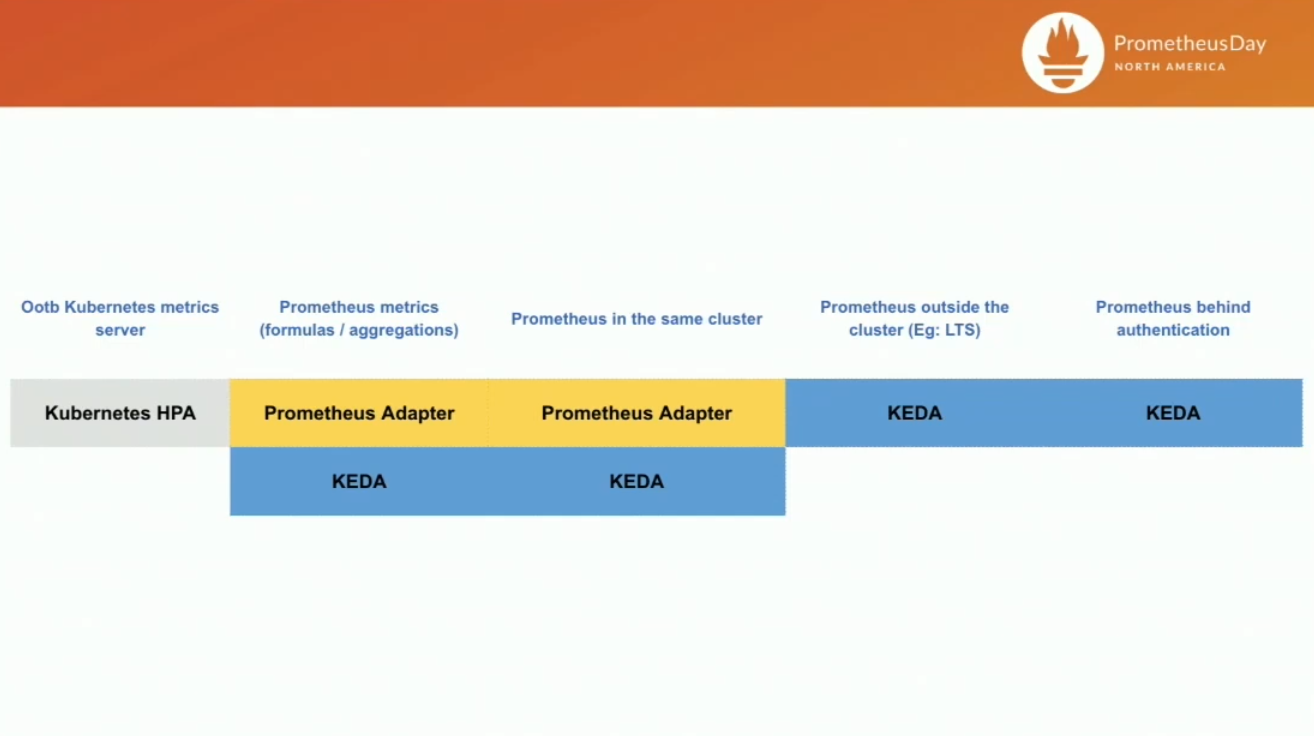
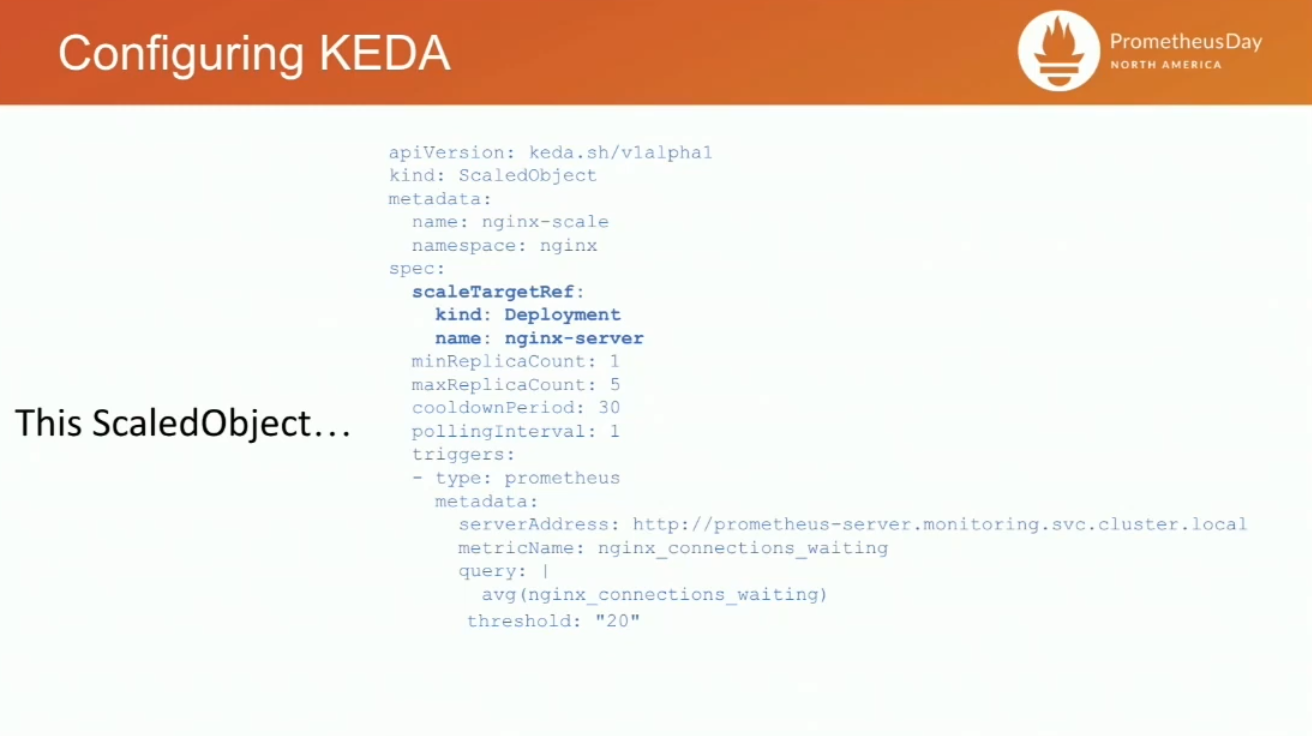
KEDA에서 Scaling Trigger로 Prometheus를 지원한다. ScaledObject CR을 사용함.
- scaleTargetRef 로 원하는 workload를 명시
- minReplicaCount, maxReplicaCount로 scale 명시
- trigers로 prometheus 사용
- metadata에 serverAddress, metricName, query 명시한다.
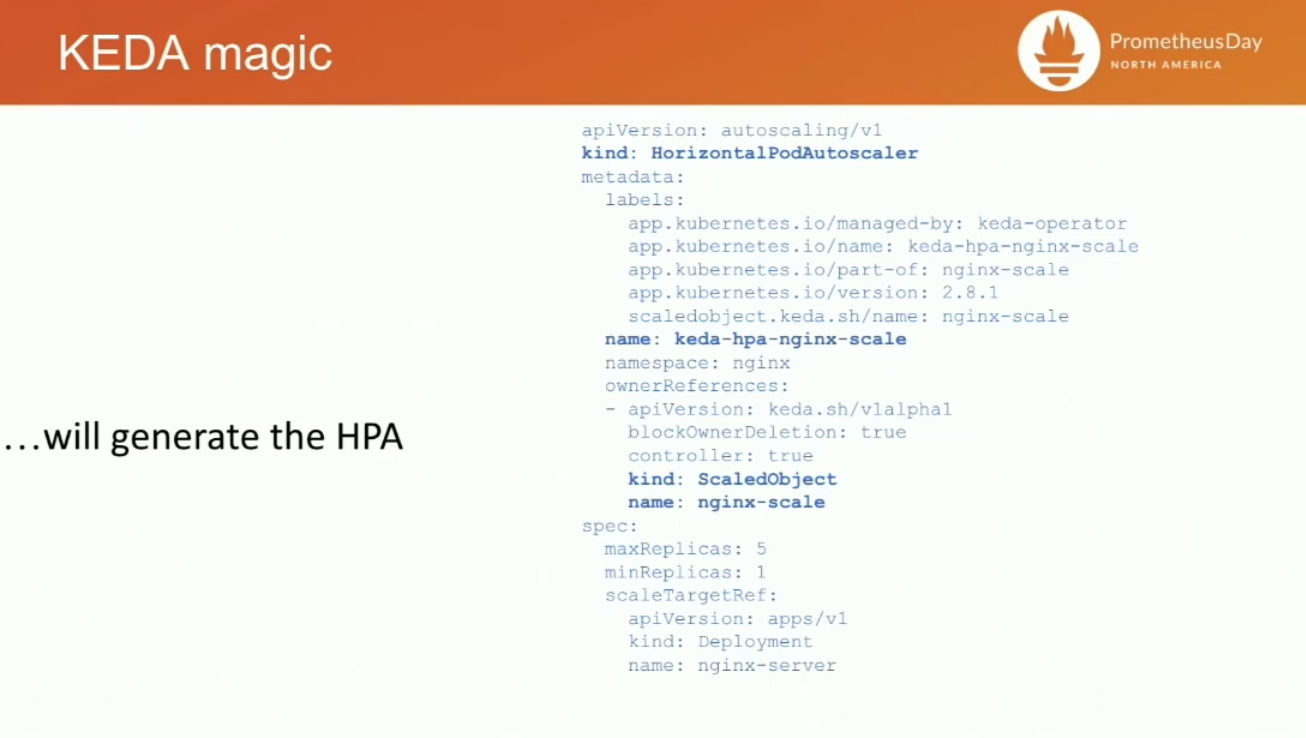
scaledObject 리소스륿 배포하면, 대응되는 HPA도 자동으로 생성된다.
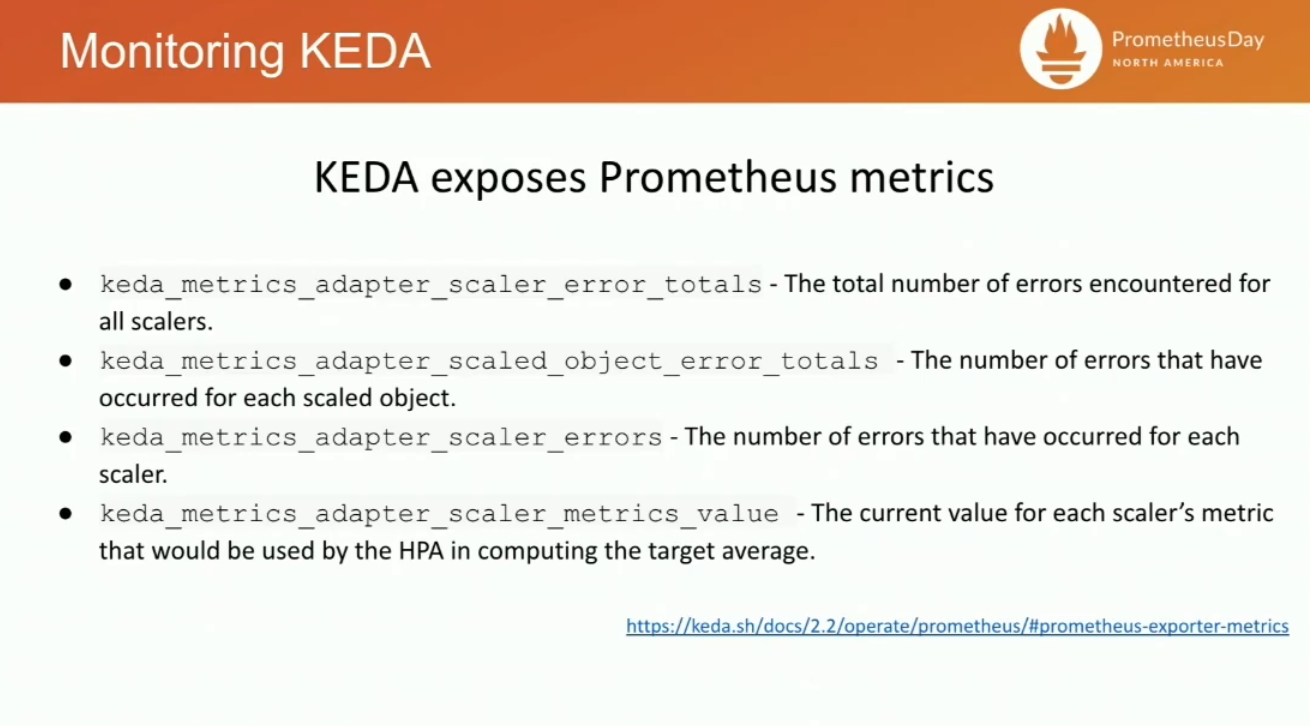
Monitoring
helm install keda kedacore/keda --namespace keda --set prometheus.metricServer.enabled=true로 keda를 expose하면, 네 개의 metric이 수집된다.- keda_metrics_adapter_scaler_metrics_value: HPA가 어떻게 동작하고 있는지를 확인할 수 있게, KEDA가 만들어서 내려주는 값.
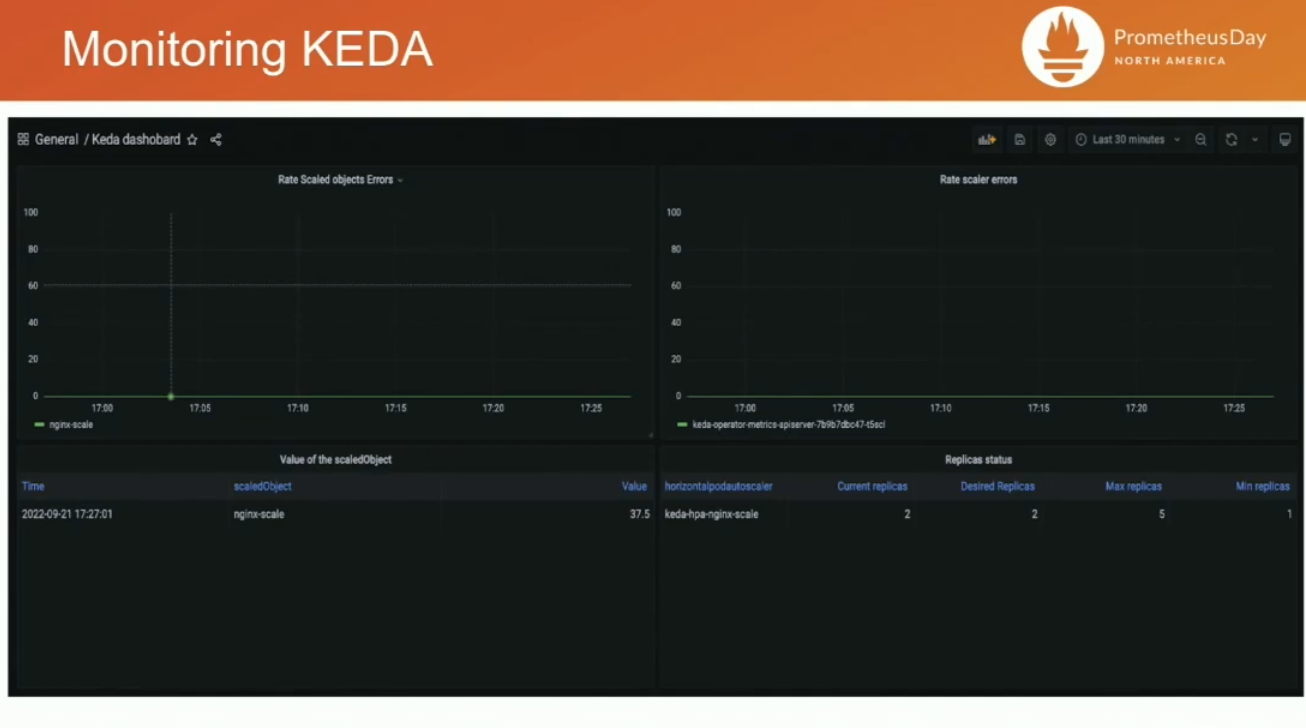
grafana 대시보드도 기본으로 제공된다.
반응형
'학습일지 > Autoscale' 카테고리의 다른 글
| KEDA HTTP Add on 코드분석 (0) | 2024.12.30 |
|---|---|
| KubeCon2024 - Scaling New Heights with KEDA: Performance, Extensions, and Beyond (0) | 2024.10.30 |
| KubeCon2022 - KEDA - Real Time and Serverless Scaling in Kubernetes (0) | 2024.07.29 |
| Kubernetes Autoscaling: HPA, VPA, KEDA, CA, Karpenter, Fargate (0) | 2024.07.15 |
| KubeCon 2018 - Rightsize Your Pods with Vertical Pod Autoscaling (0) | 2020.12.18 |